Setting Up An ELK Server and a Filebeat Endpoint
Two days ago I decided I wanted to set up an SIEM to monitor an old Dell desktop my grandfather gave to me a few years ago. I had turned the Dell into a small home server initially, hosting file sharing over samba, using it as my main SSH device1, and even hosting a minecraft server for me and my buddies at one point. Eventually I stopped using it but it remained running, plugged into the internet and waiting to be molested by Shodan searches galore2.
And so after I graduated college and moved down South I finally decided to tackle this little desktop. I chose an SIEM as my project for a few reasons:
- To improve my system hardening skills
- To practice my
script kiddiepentesting abilities on a bare metal machine - To find out if leaving an Ubuntu server running unmonitored for ~2 years had any lasting impact on the machine3
- Uhhh something something resume?
First thing's first, I needed to figure out which SIEM to use with my computers: The Ubuntu server would be sending it's logs to my main desktop running Manjaro, so the program would have to be compatible with both systems.
My first mistake was picking Wazuh and trying to get that to work on an Arch-based distro. Since there isn't an official release of Wazuh for Arch I tried to get the community maintained version off the AUR, but quickly realized there was just too much to fix before I could get anything started. Specifically, for whatever reason the AUR maintained Wazuh didn't come with a certificate generation script, and after looking into how I could generate them myself it just didn't seem worth it. So I bit my first (of many) bullets and pivoted to using ELK (Elasticsearch4 + Kibana) on my desktop and Filebeat on the Ubuntu machine.
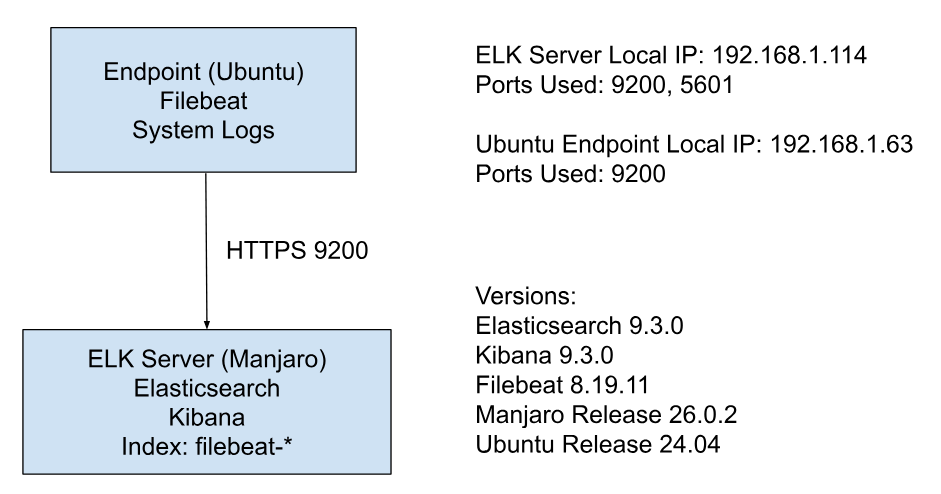
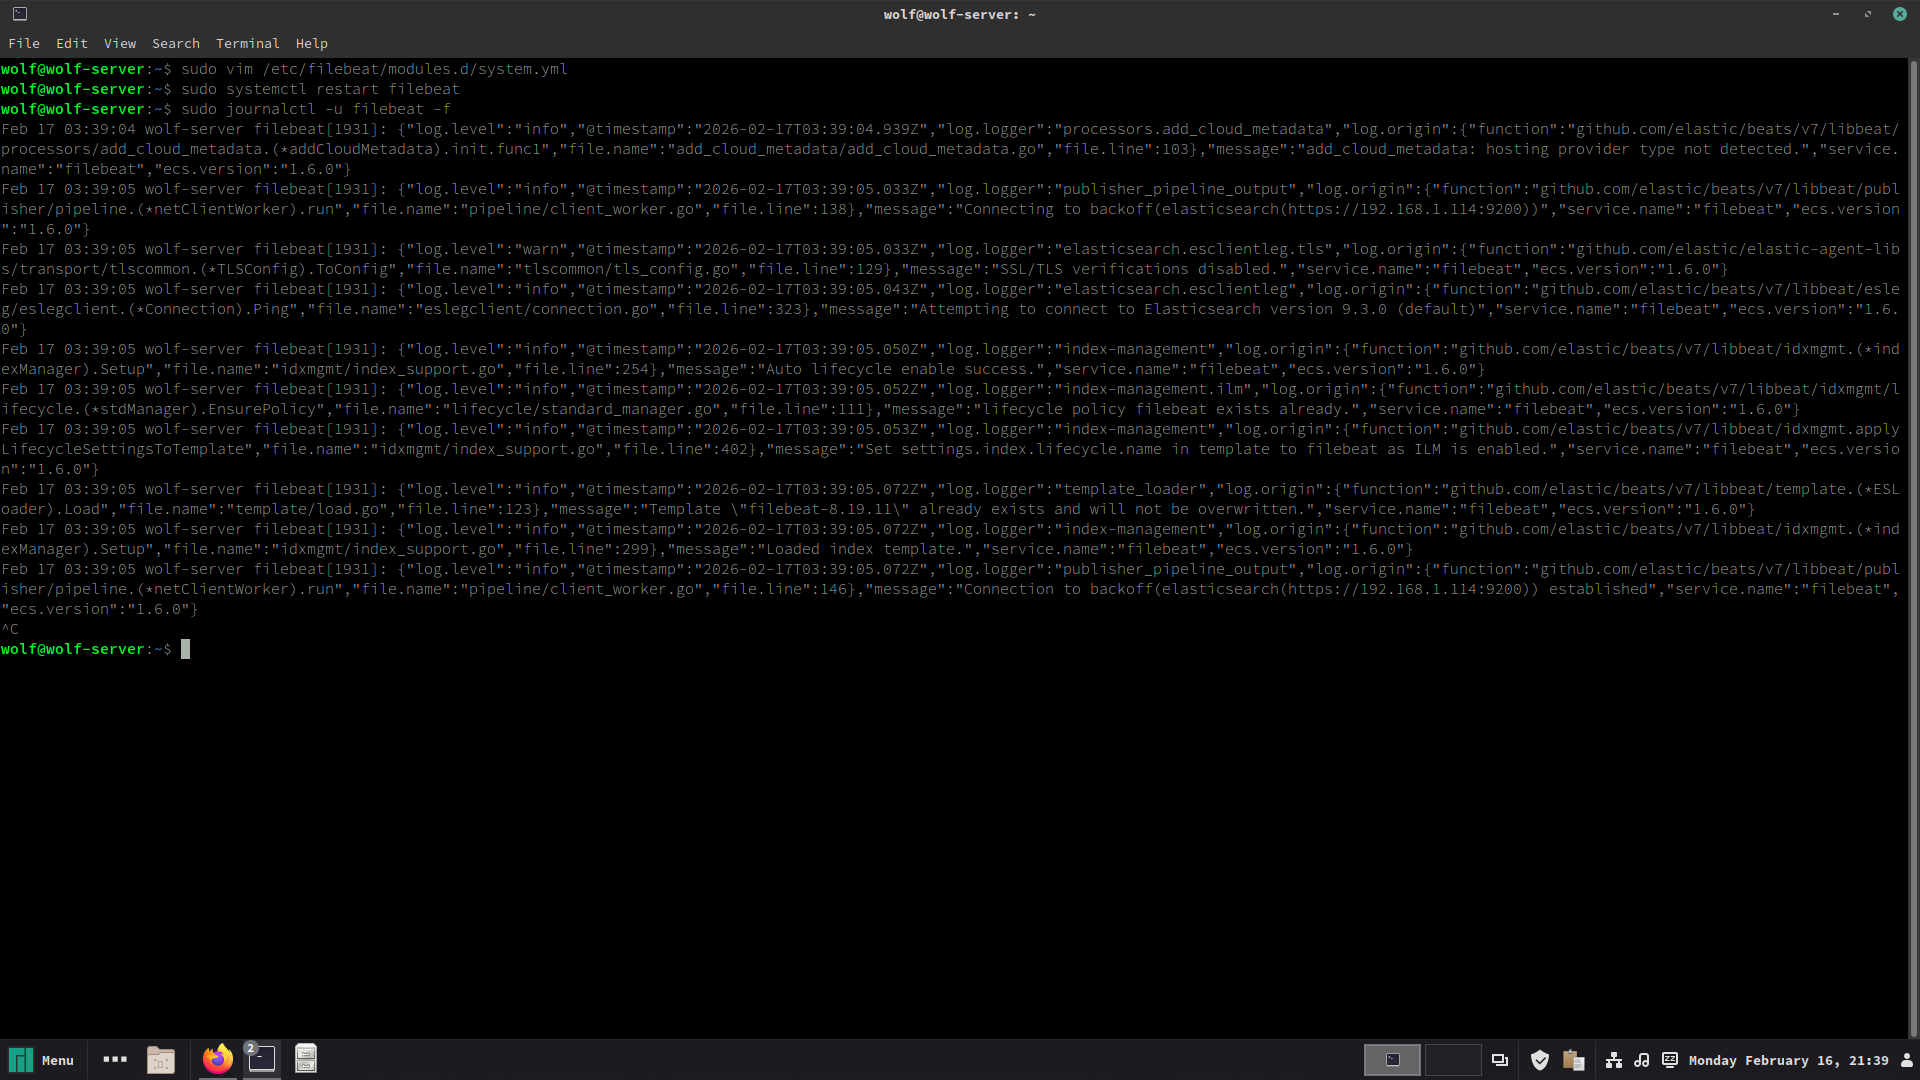
Essentially, Filebeat will collect and send the system logs from the Ubuntu machine over to Elasticsearch running on the Manjaro Desktop via HTTPS. Kibana is then used to view and manage the data that Elasticsearch outputs, serving as the frontend of the system.
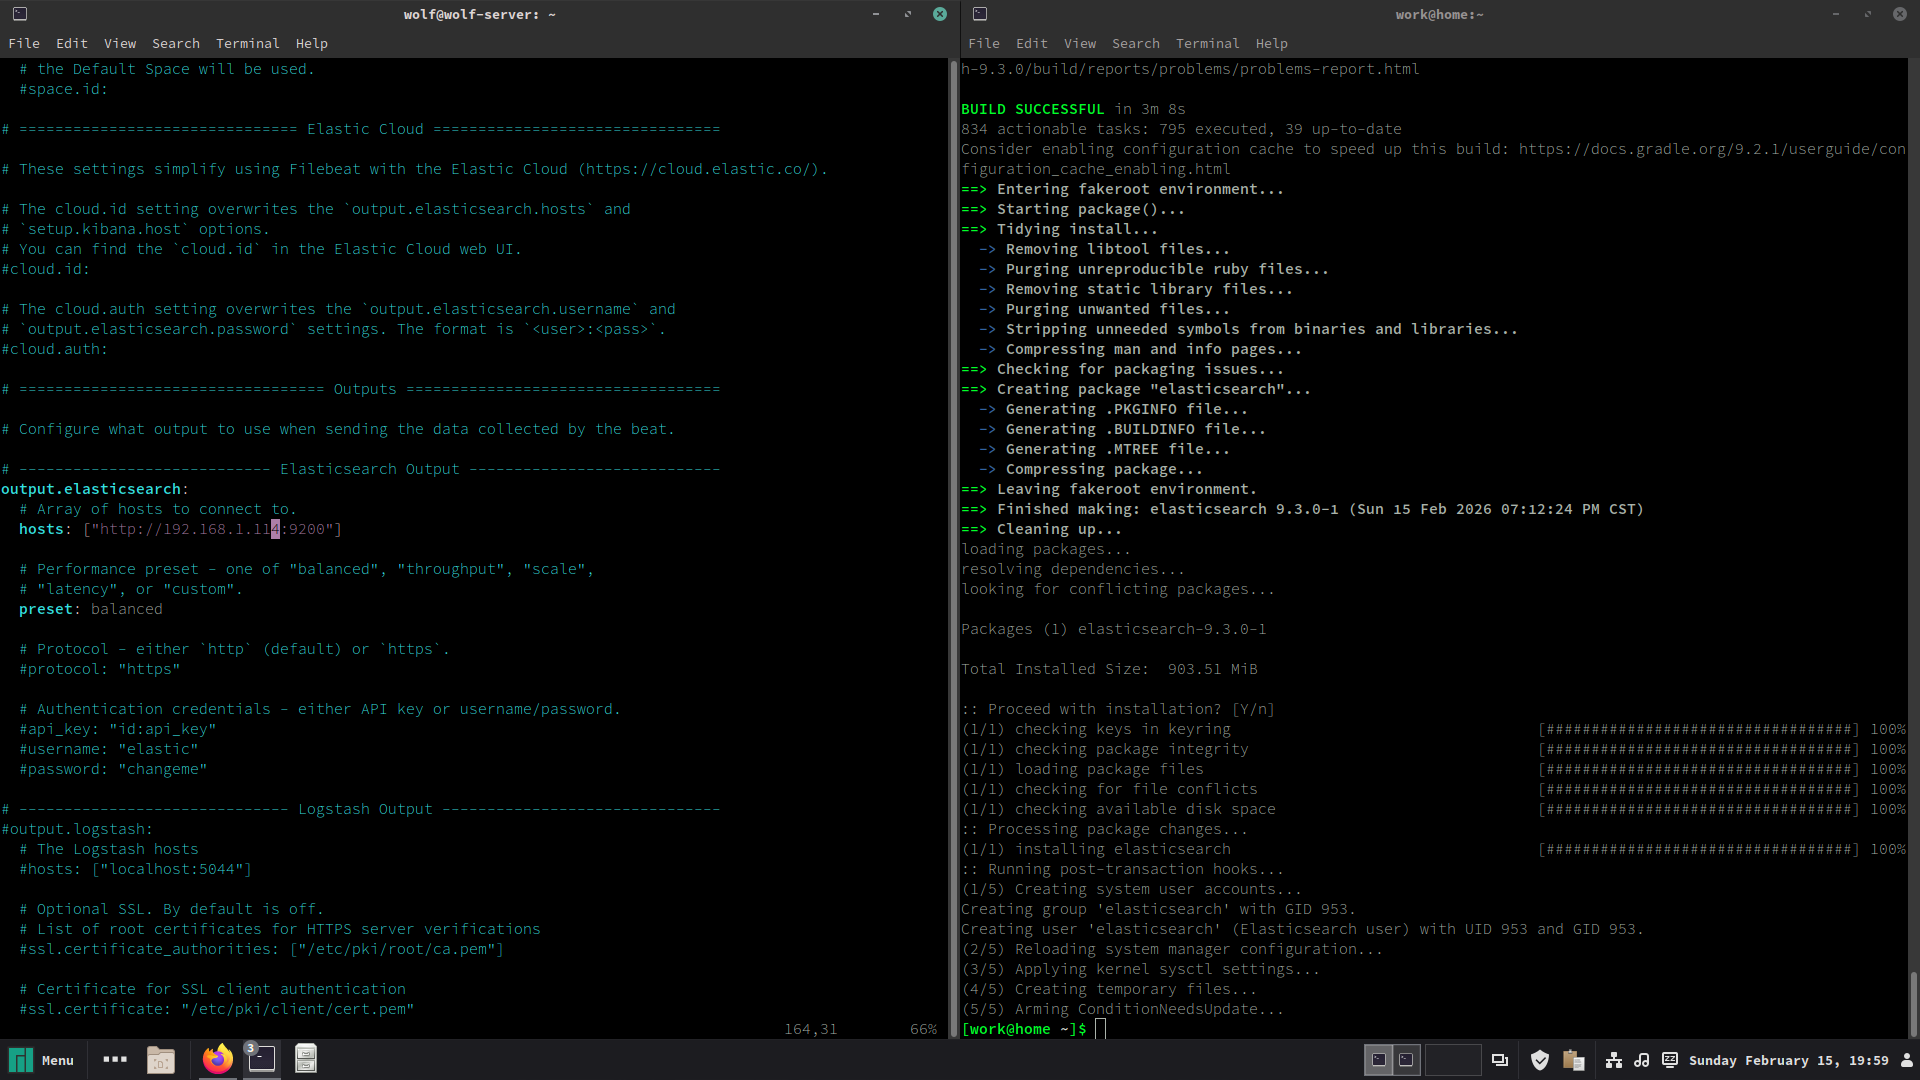
After installing everything from the AUR I began configuring both Elasticsearch and Kibana to be able to speak with each other, which turned out to be easier said than done. I was able to get Elasticsearch up and running fairly quickly, generating a password and using curl to verify all was good. Kibana, however, was another demon.
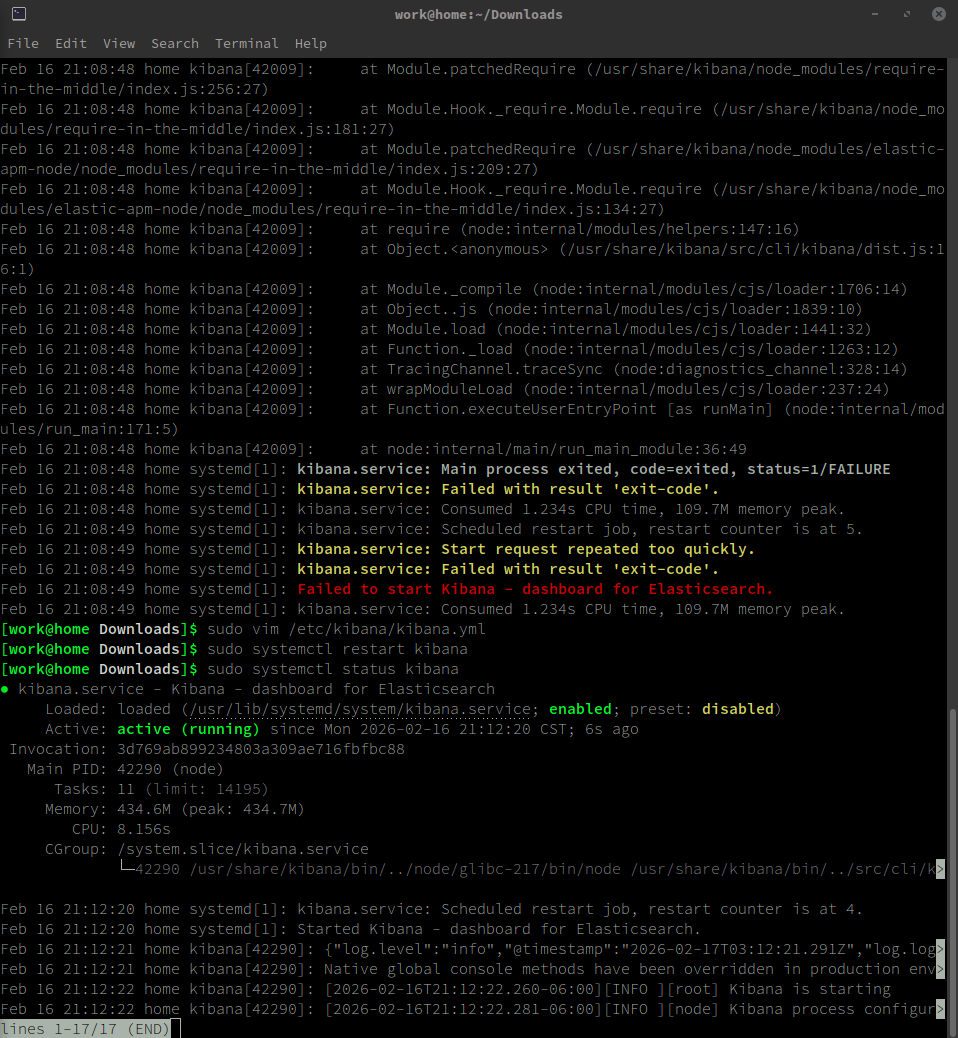
After struggling to get the web interface loading for a while I found that despite systemctl showing Kibana as actively running, journalctl showed it was repeatedly crashing and restarting. Apparently this is Kibana's natural reaction to any config issue, and became a familiar sight in journalctl for the next few hours.
The first issue I solved was just matching the versions; apparently the Elasticsearch I pulled off the AUR was 9.3.0-SNAPSHOT, whereas Kibana was just 9.3.0. A quick reinstall (2nd bullet bitten) seemed to fix the issue, yet Kibana was still stuck in a crash loop. There was seemingly an issue with Kibana and ES not consistanly communicating through Ipv6 that I fixed, yet still no working Kibana. More journalctl digging showed that this time it was the authentication method in Kibana's config file that wasn't properly set up.
At this point I began trying a ton of different fixes out of desperation and exhaustion: I changed the permissions on Elasticsearch's http cert to be readable by anyone in case that couldn't be read, then I changed the whole of Elasticsearch's directories to be root executable in case they couldn't be accessed by Kibana, then adding an Elasticsearch token for verification instead of a username and password, then changed the token a dozen times because there was an error saying the token couldn't be read, before eventually throwing in the towel for the night.
Despite bashing my head against my monitor for three hours trying to get two pieces of software that are supposed to work together to work together, I was actually feeling pretty good; Elasticsearch was running and returning JSON when curl'd, and I knew that getting Kibana to connect was going to be a simple fix, I just had to figure out what it was.
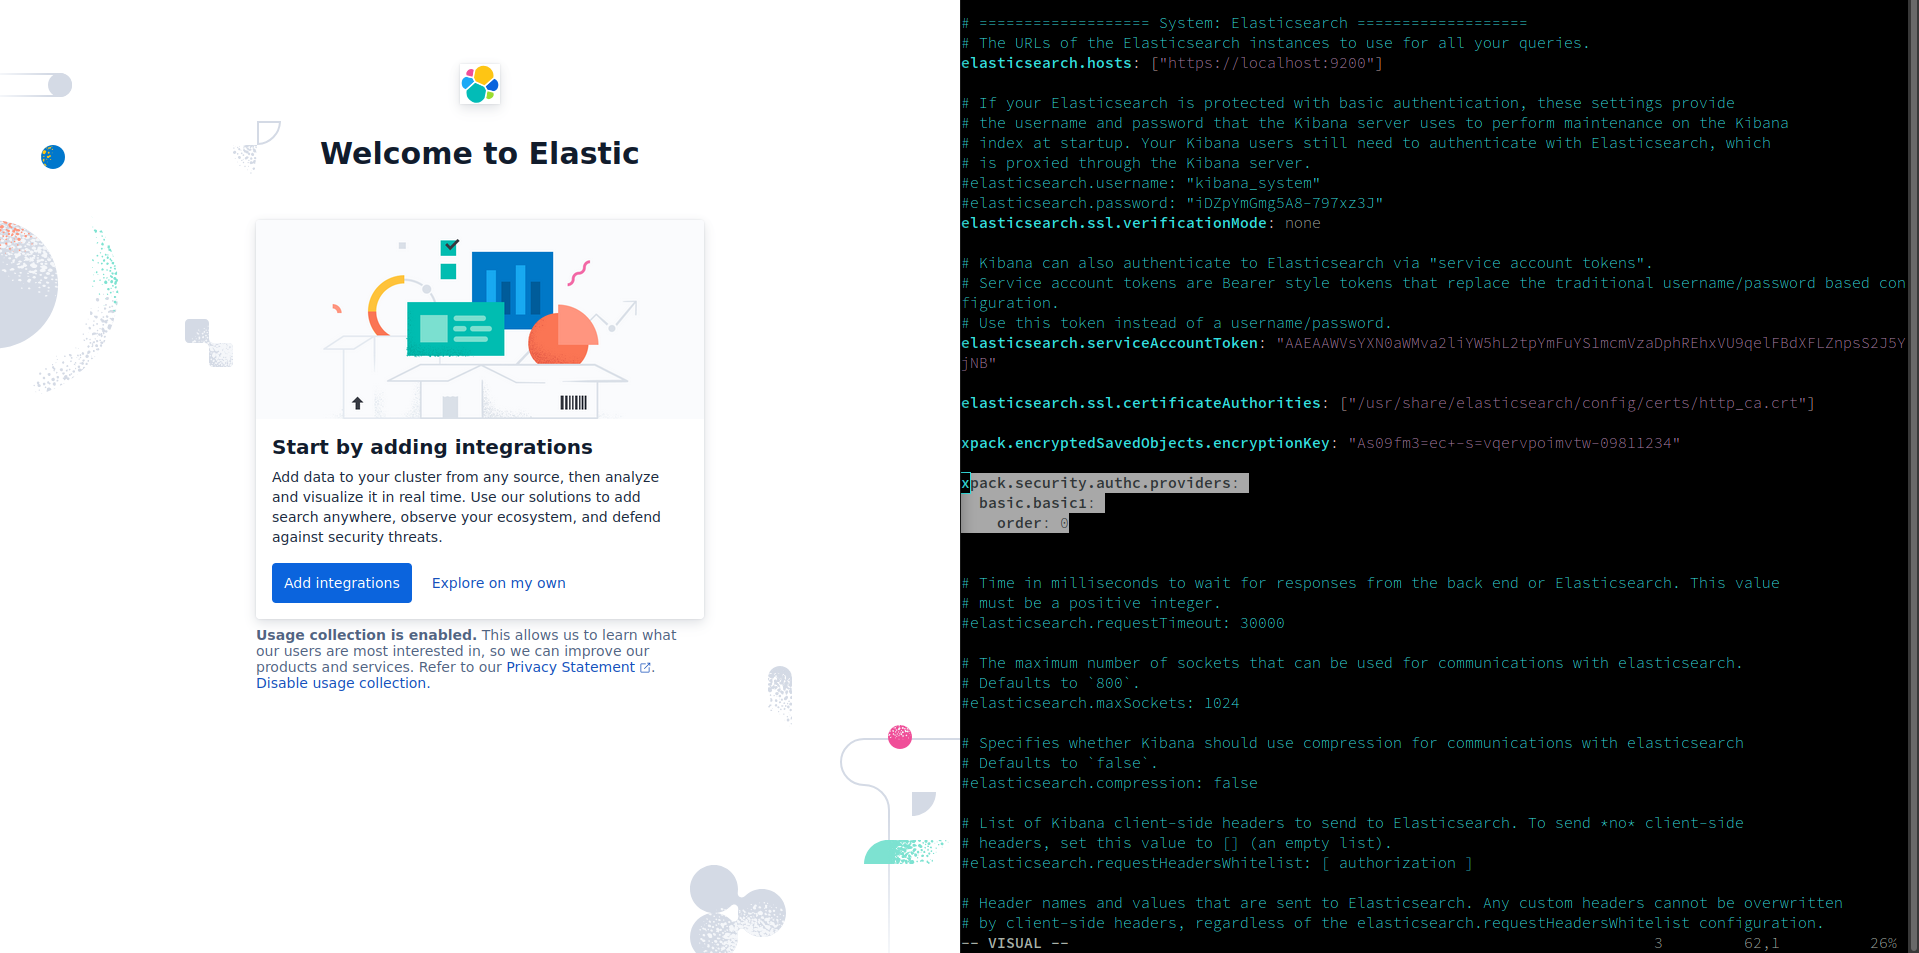
I came back to the problem the next day and was able to solve things fairly quickly. I first made a systemd service for Elasticsearch so that it could just run in the background before getting back into the trenches with Kibana. We picked up where we left off, patching errors in journalctl hoping that surely this would be the error that is causing all the crashes. A missing SSL verification config here, a fresh-made token there, until I stumbled into a passage on the Elastic user docs that finally got Kibana and Elasticsearch connected:
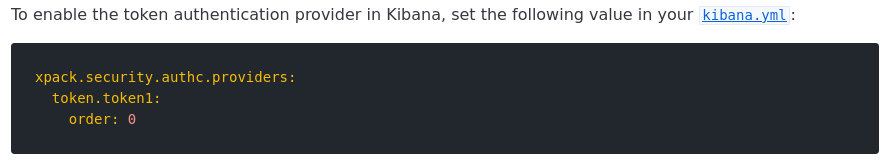
I had basically just needed to specify that I was using a token as my authentication provider this whole time, which of course is a painfully easy and somewhat obvious fix, but I was so relieved to have this fixed that I felt no shame, only relief.
Of course it wasn't exactly easy sailing from there, but things got fixed pretty quick from that point on – the default amount of RAM allocated to Kibana was capped at 512MB, which of course was way too low and crashed it every time it tried to start up. A quick vim into the service allowed me to change the default to 2GB and it finally loaded up the web interface.
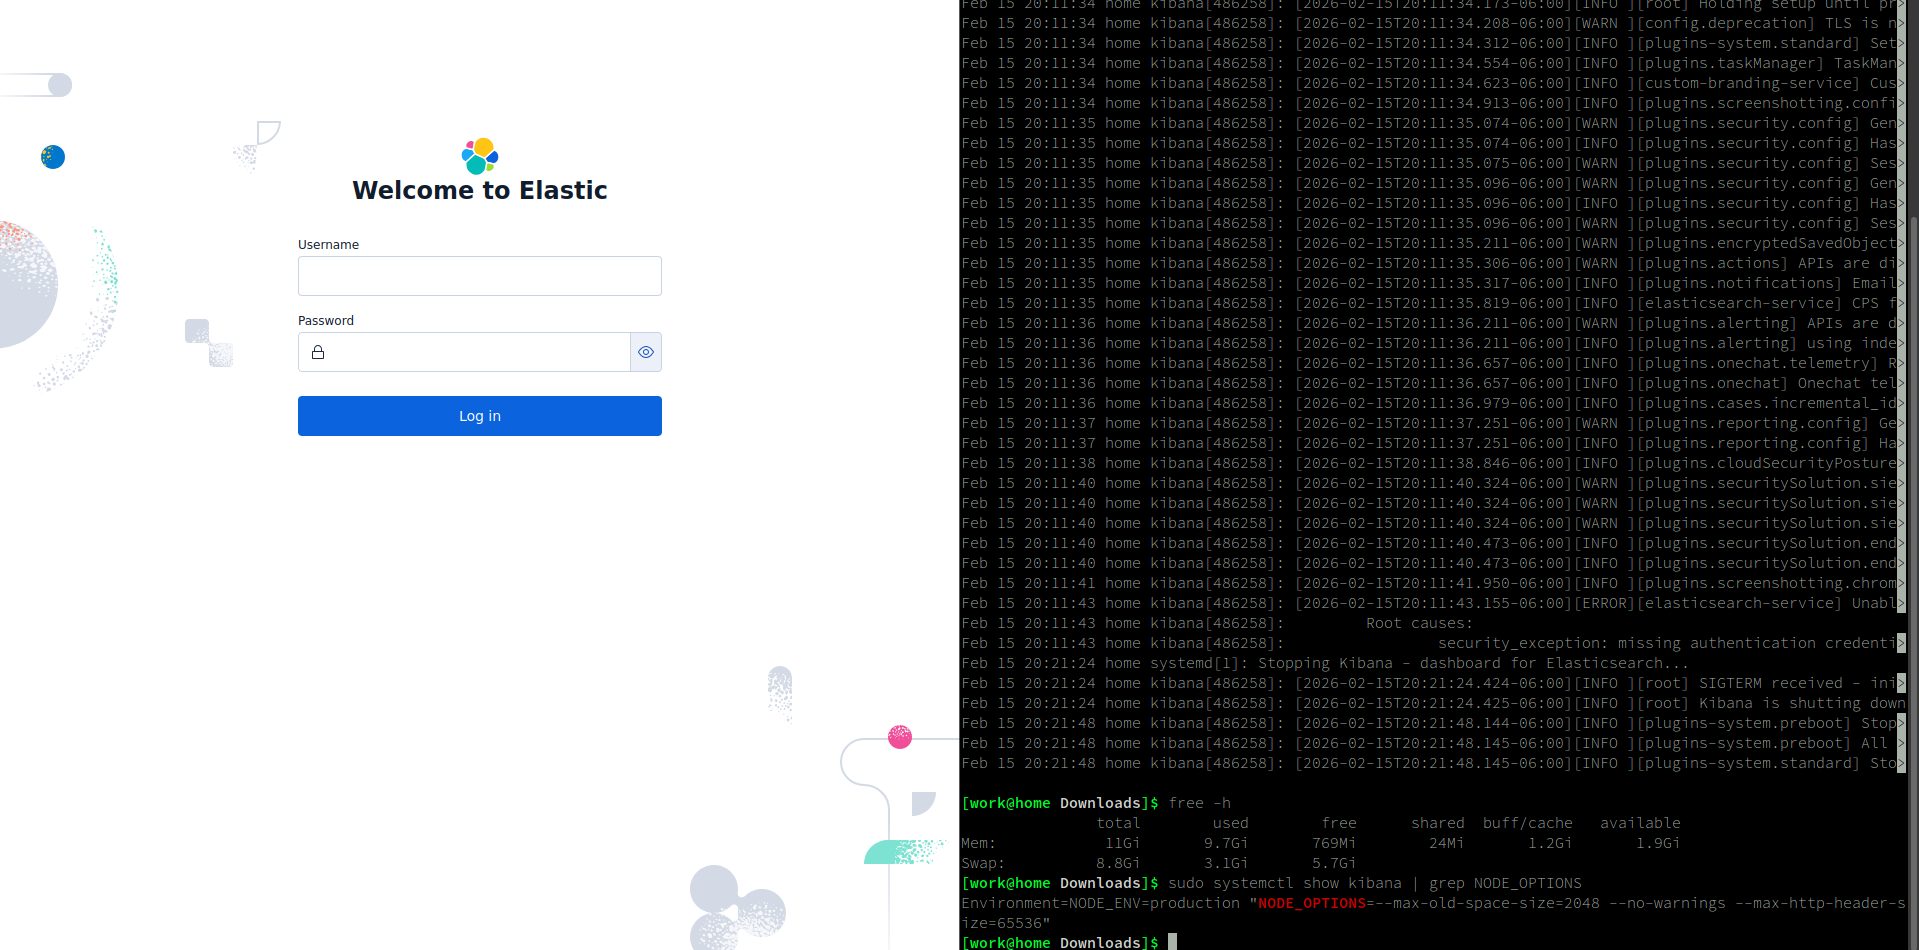
The last issue I resolved was the login screen, which for some reason was still enabled even though I was using a token for my authentication; I found I just needed to change the auth provider to the username and password credentials and they immediately worked. I was finally in Kibana :)
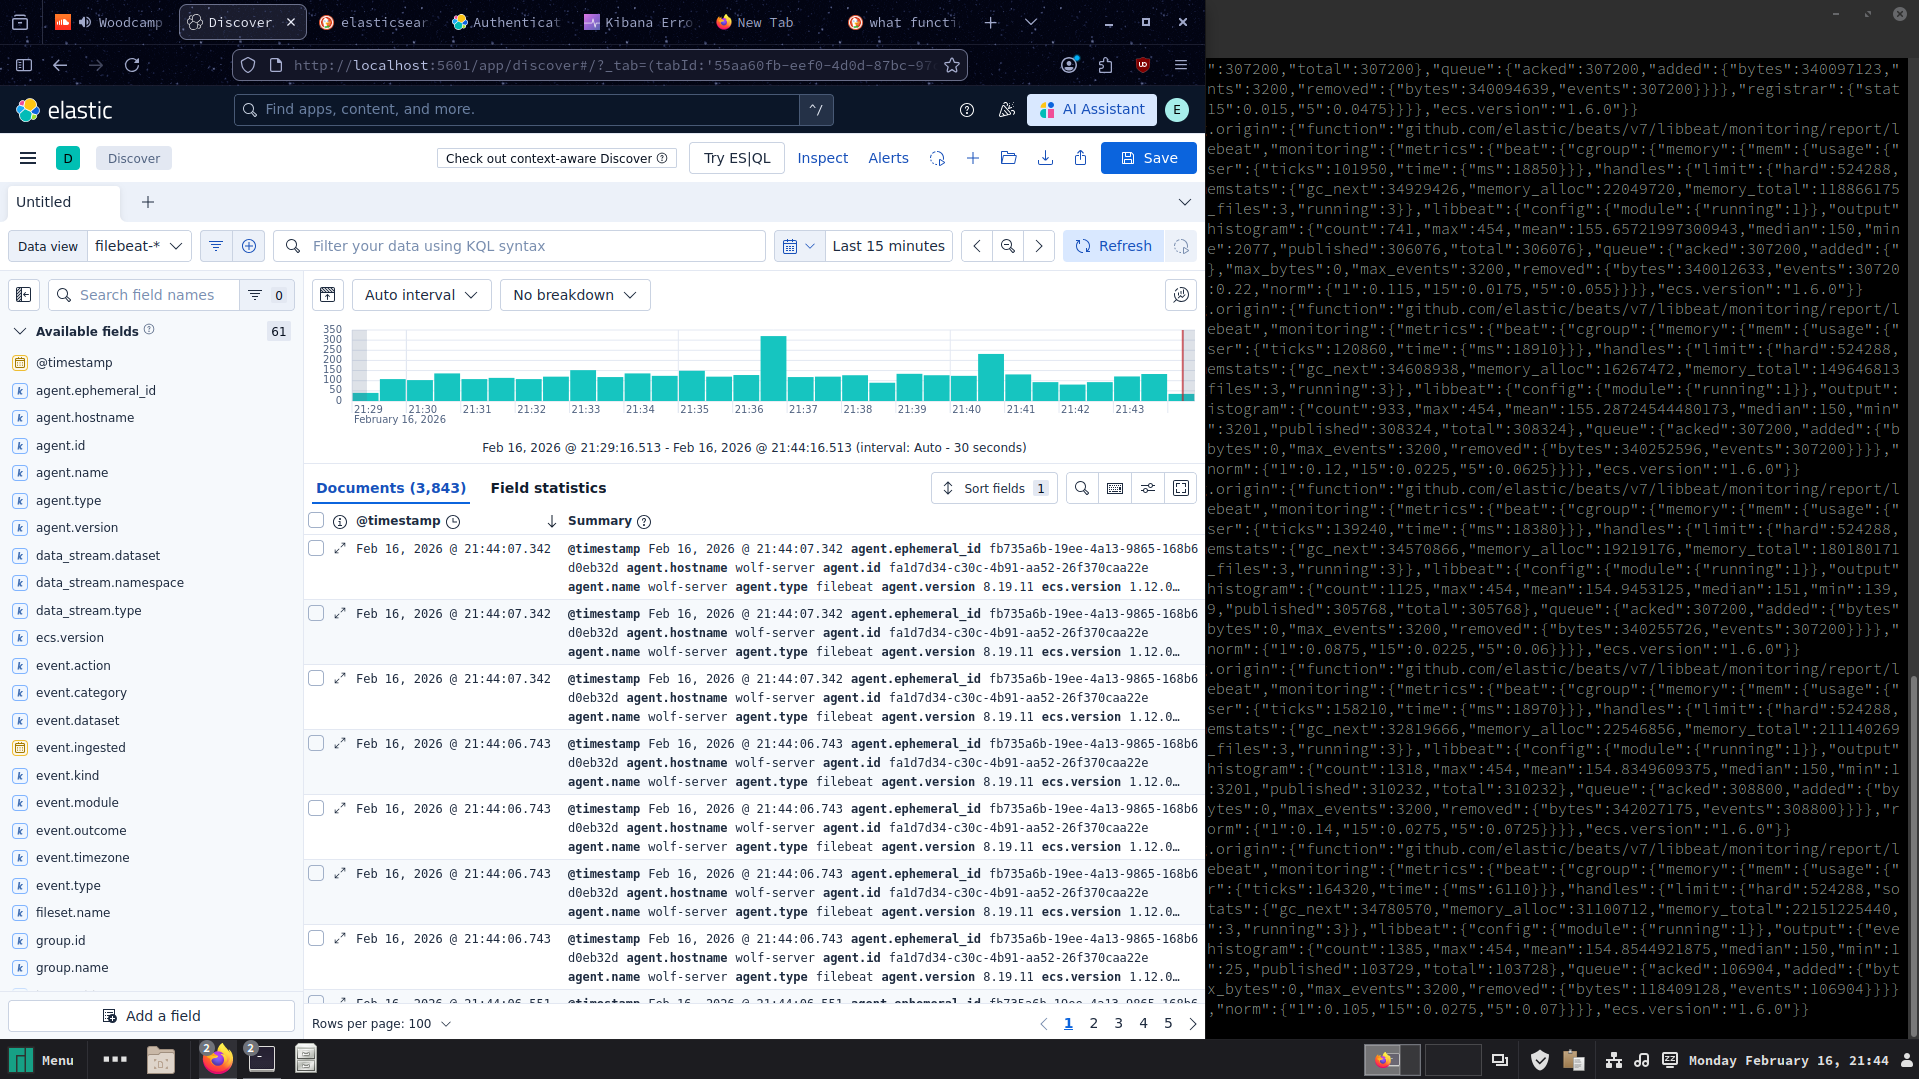
While I certainly didn't expect the set-up to be this much of a journey, I'm glad I went through the struggle because I am now far more understanding of how Elasticsearch and Kibana actually function together and individually on a system level. Next up is going to be running some different attacks on the endpoint and learning how to read the logs outputted.